


The efficiency everyone cites is not an achievement. It is a description of where the company drew its boundary.
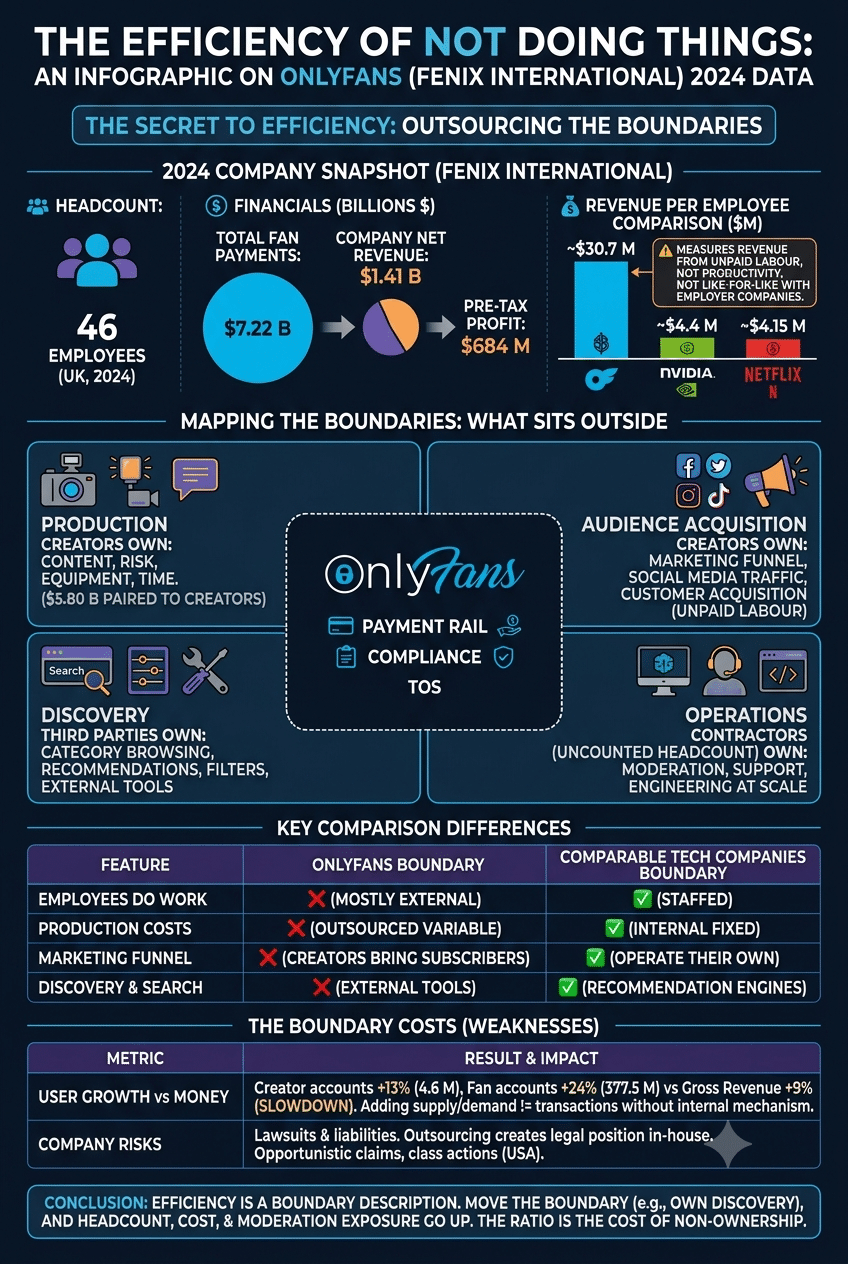
Fenix International, the UK company that owns OnlyFans, reported 46 total employees for 2024.

In the same fiscal year, $7.22 billion in fan payments passed through the platform. Net revenue — the share the company keeps — was $1.41 billion. Pre-tax profit came to $684 million. The accounts also note a large number of third-party contractors running the site, which is the first clue about what the headline number is actually measuring.
Divide the net revenue by the payroll and you get roughly $30.7 million per employee. For scale, Nvidia sat around $4.4 million and Netflix around $4.15 million on the same measure, according to research compiled from Forbes Global 2000 data as of August 2025. Those were the top of the technology sector.
The figure has circulated as a curiosity — the most efficient company nobody talks about. Read properly, it is not a story about productivity. It is a map of everything the business decided not to own.
What sits outside the boundary
Production. The company makes no content. Every photograph, video and message on the platform is produced at the creator's expense, on the creator's equipment, in the creator's time. A studio carries production risk; this business carries none. In 2024 it paid $5.80 billion out to creators under its 80/20 split, which is a large number until you notice it is a variable cost that only exists when revenue does.
Audience acquisition. There is no marketing funnel to speak of. Creators bring their own subscribers, recruited on social platforms the company does not operate and cannot influence. The customer acquisition cost sits on the supplier side of the ledger, paid in unpaid promotional labour.
Discovery. The platform has no category browsing, no location filter and no recommendation feed. Its organic search profile shows the consequence: the overwhelming majority of search traffic arrives on brand-name queries, people typing the front door rather than describing what they want. The browse function was never built, so third parties supply it — a fan trying to filter by category ends up on a tool that does this for you assembled by someone with no stake in the transaction and no share of it.
Operations. Moderation, support, engineering at scale — much of it sits with contractors who do not appear in the headcount and therefore do not appear in the ratio.
Four functions that any comparable business would staff, all of them pushed across the boundary. What remains inside is the payment rail, the compliance apparatus and the terms of service. Forty-six people can run that.
The number is real and the comparison is not
Two things need saying before the ratio gets repeated anywhere else.
The gross figure is misleading. Dividing $7.22 billion by 46 produces something like $157 million per head, and that number is meaningless — most of it is money in transit to somebody else. The company's own revenue is $1.41 billion, and that is the only figure worth dividing.
The comparison to Nvidia is not like for like either. Nvidia designs and sells a physical product with an enormous engineering organisation inside the boundary. Its ratio measures work its own staff did. OnlyFans' ratio measures work almost entirely done by people the company does not employ — 4.6 million creators and an uncounted contractor base. Move the contractors inside the line and the number falls sharply. Nobody outside the company knows by how much, because the accounts do not say.
This is not a criticism of the accounting, which is standard. It is a caution about the metric. Revenue per employee rewards the business that employs fewest people, and the cleanest way to employ fewest people is to arrange for someone else to do the work.
What the boundary costs
The model has a visible weakness, and it turned up in the same set of accounts.
User growth outran the money. Creator accounts rose 13% to 4.634 million and fan accounts rose 24% to 377.5 million, while gross revenue grew 9% — down from 118% in 2021 and 19% in 2023. More people, less growth per person. On a platform where the company owns no mechanism for connecting the two sides, that is what you would expect: adding supply and adding demand does not by itself produce transactions.
The company also names its own exposure. Among the risk factors in the annual report, Fenix lists lawsuits and liabilities, describing the group as a target for opportunistic litigation claims, particularly class actions in the United States. A business that outsources its labour force to independent contractors and its customer relationships to third-party platforms retains one thing in-house: the legal position.
There is a version of this where the boundary moves. Owning discovery would mean building recommendation infrastructure, hiring for it, and taking responsibility for what it surfaces — all of which shows up as headcount, cost, and moderation exposure. The ratio would get worse. Whether the revenue would get better is the question nobody at the company has publicly asked.
For now the arrangement holds. Forty-six people, a payment rail, and four and a half million suppliers doing the rest.


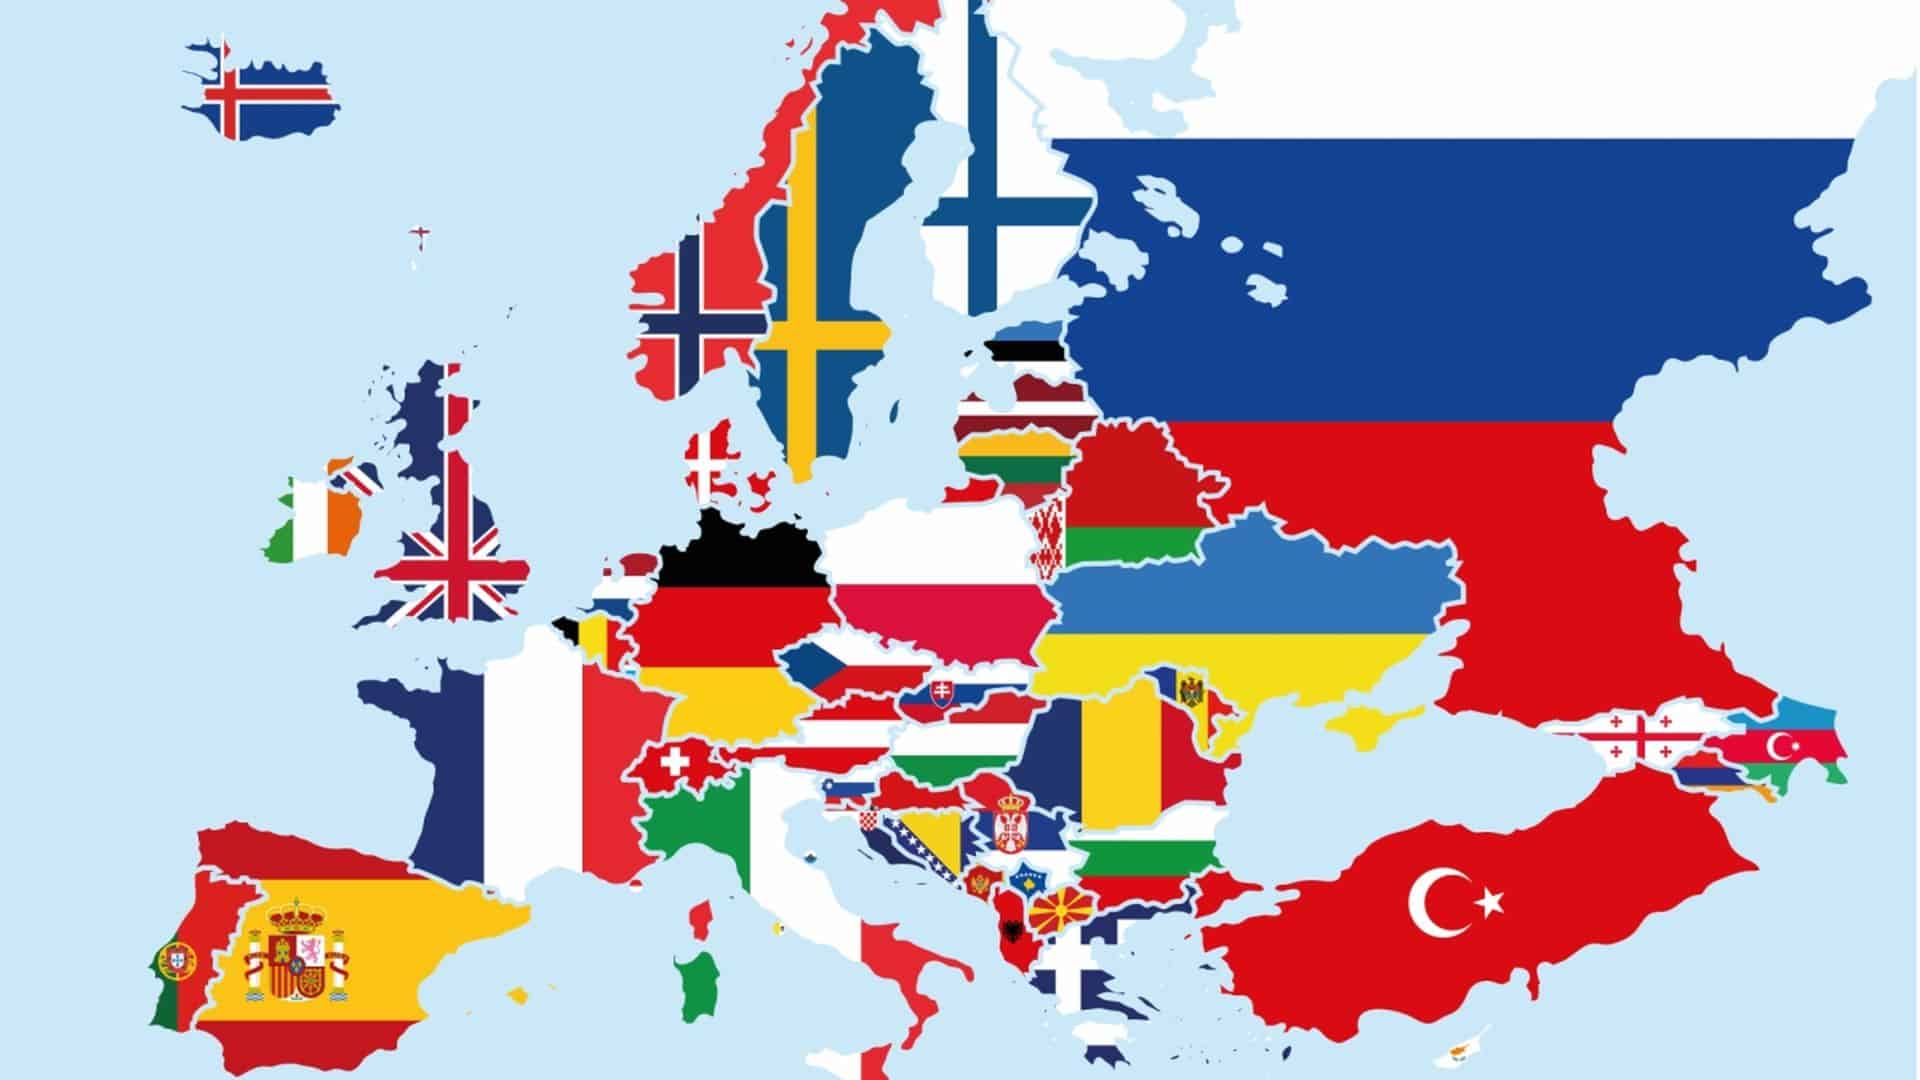
Find OnlyFans by country



Prime list new onlyfans models



The Rising Stars of OnlyFans: Meet the Women Who Are Changing the Game of Adult Entertainment



Insanely Hot OnlyFans Profiles and What You’ll Get from Them



Prime list new onlyfans models



Nude OnlyFans Babes That Will Make Your Day Better


Get flashed live at Camsoda.com


The history of gay porn, from taboo to bestgaysites.com